Log your life with your voice.
NogginLogger turns quick voice notes into structured health and life data — tracking food, exercise, spending, mood, and more, all from a single app.
Installation & Setup
NogginLogger is available two ways: download it free from the App Store on iPhone & iPad, or install the Android APK directly (no Google Play Store needed). The same account works across iOS, Android, and the web dashboard.
On iPhone & iPad (App Store)
NogginLogger is live on the App Store — download it here, or search NogginLogger in the App Store. Open the app and sign in with email, Google, or Apple to get started.
On Android (APK)
NogginLogger is distributed as an Android APK — a direct install file that doesn't require the Google Play Store.
Obtain the .apk file from the link provided to you. Download it directly on your Android device, or transfer it from your computer via USB or cloud storage.
Android blocks installs from outside the Play Store by default. When prompted, tap Settings and enable Install unknown apps for your browser or file manager. This is a one-time step.
Tap the downloaded .apk file and follow the on-screen prompts to install. The app will appear in your launcher as NogginLogger.
On first launch, Android will ask for microphone access. Tap Allow — this is required for voice recording to work.
Works everywhere: Your NogginLogger account is shared across the iOS app, the Android app, and the web dashboard — sign in once with the same email, Google, or Apple login and your data is in sync everywhere.
Signing In
You'll need an account to use NogginLogger. Your account gives you access to both the mobile app and the web dashboard, and you can sign in with email + password, Google, or Apple.
Launch NogginLogger from your home screen or app drawer.
Tap Sign In / Sign Up. Choose email + password, Google, or Apple. New users are created automatically — no invitation needed.
The app will remember your session — you won't need to sign in again unless you explicitly log out.
Timezone Sync
NogginLogger automatically detects and syncs your device's timezone to your account on startup. This ensures your entries are filed under the correct day, even if you travel. No action needed on your part.
Keeping the App Updated
Because the Android app installs directly from the APK file (not the Play Store), it doesn't update itself automatically. When a new version is available, a cyan "Update available" banner will appear on the main screen of the app. Tap it to download the latest APK and re-install — your account and local data stay intact.
You can also grab the newest APK any time from the same download page you first installed from.
Recording Voice Notes
The core of NogginLogger is the voice note. Just speak naturally — the AI handles the rest. No forms to fill out, no dropdowns to tap through.
Making a Recording
The large button in the center of the screen starts a recording. A timer shows how long you've been speaking.
Speak naturally. You can mention food, exercise, how you're feeling, what you spent money on — anything. You can log multiple things in a single recording.
Tap the record button a second time to stop. The recording uploads automatically.
The app sends your audio to be transcribed and analysed by AI. This usually takes 5–15 seconds. Your entry will appear on the dashboard once it's processed.
Tip: You don't need to be precise. "I had a coffee and a bagel for breakfast, maybe 400 calories" works just as well as a perfectly structured sentence. The AI is designed to handle natural, casual speech.
What to Say
You can log almost anything. The AI automatically assigns a category to help organize your entries — but the real power is in tags, which you can fully customize. Here are the built-in categories:
Tips for Great Logs
Be specific about quantities when you can — "three eggs" or "about 500 calories" helps the AI give you more accurate data. But a rough estimate is always better than nothing.
Log multiple things at once. You can say "I had a burger and fries for lunch, probably 900 calories, then went for a 30-minute walk" and NogginLogger will create separate entries for the food and the exercise.
Log right away when the information is fresh. The app is designed for quick, low-friction captures — a note doesn't have to be long or thorough to be useful.
Calorie estimates: When the AI estimates calories rather than using a figure you provided, the value is shown with a ~ prefix (e.g., ~450 kcal) so you always know what's an estimate. You can edit any entry on the dashboard to update it with an exact figure.
Viewing Your Recordings
The main screen of the app shows a list of your recent recordings. You can see the status of each one — whether it's still processing, or has been successfully logged. Tap any recording to play it back.
Quick Entry (Typed)
You don't need to record your voice to log something. The dashboard has a text input bar fixed at the bottom of the screen (like a chat app) where you can type or paste entries directly.
Type naturally — "Had a chicken sandwich for lunch, about 500 calories" — and press Enter to submit. Use Shift+Enter to add a new line without submitting. The textarea auto-resizes as you type.
Typed entries skip the transcription step and go straight to the AI parser. The result is the same as a voice note — structured entries with categories, values, and tags.
There's a 2,000 character limit with a live counter so you know how much room you have. Typed entries count toward your daily entry limit, just like voice recordings. You can even paste game share results (like Wordle grids) and the AI will parse them.
Tip: Typed entries are great for quick logging from your desk. Voice entries are better when you want to ramble naturally and let the AI sort it out. Both count toward your daily entry limit.
Desktop Mic Recording
The input bar also has a microphone button for recording directly from your browser — no mobile app needed.
A recording overlay appears with a timer and progress bar. Your browser will ask for microphone permission the first time.
The recording auto-stops when you hit your tier's maximum duration (with a 5-second countdown). Minimum recording length is 2 seconds.
Click the gear icon next to the mic button to select a specific microphone device and test it with a playback preview. Helpful if you have multiple audio devices (headset, webcam, built-in).
Microphone not working? If your desktop voice recordings aren't being transcribed correctly, your browser may be using the wrong microphone. Click the gear icon next to the mic button to select the correct device, or check your browser's site settings for microphone access.
Dashboard & Viewing Data
Your NogginLogger dashboard is a web page you can open in any browser. It shows all your logged entries, trends over time, and summaries by category.
Accessing the Dashboard
Open your browser and go to the URL you were given (e.g., noggin.rebeltech.pro). Sign in with the same credentials as the mobile app. The dashboard works on any device — phone, tablet, or desktop.
Dashboard Layout
On desktop, the dashboard uses a two-column layout. The left column shows your daily snapshot, custom trackers, daily goals, and category cards. The right column shows your entry list with search and export. On mobile (screens under 768px), the layout switches to a tabbed view with Summary and Entries tabs so you can swipe between the two views.
Four category cards appear on the overview — Nutrition, Exercise, Spending, and Health — each with sparkline charts showing recent trends. Click any card to drill into that category's detail view.
Day Paging
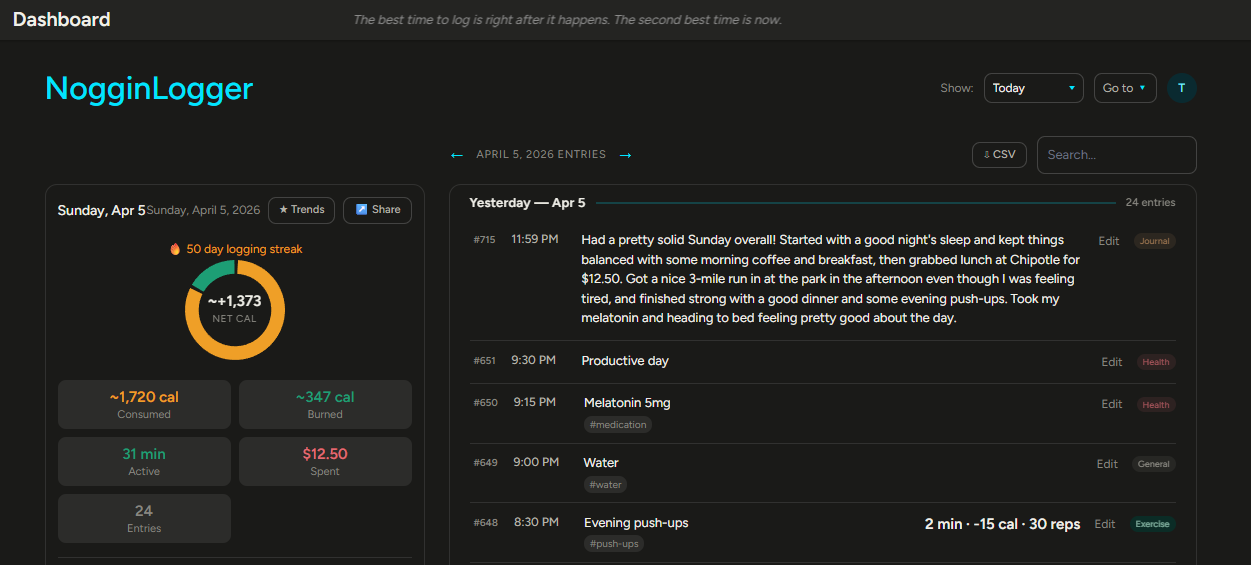
When viewing Today's entries, arrow buttons appear next to the "Today's Entries" heading. Click the left arrow to page back through previous days, or the right arrow to return. The label updates to show the date you're viewing (e.g., "March 31, 2026 Entries"), and the snapshot, custom trackers, goals, and entries all scope to that specific day.
Reading Your Entries
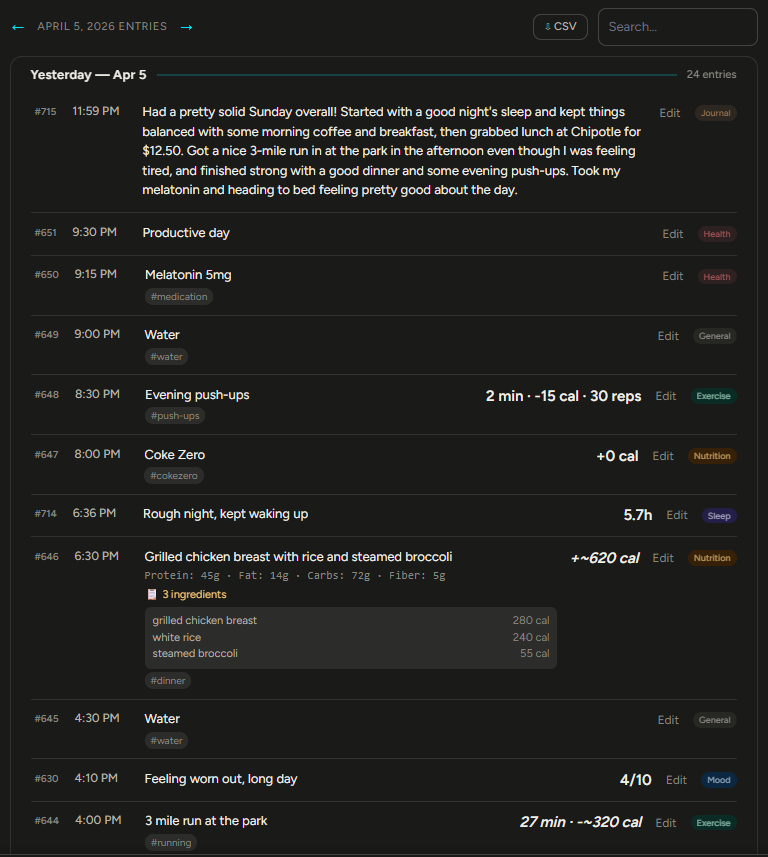
Entries are shown in reverse chronological order, newest first, grouped by day with sticky headers. Each entry shows:
- An entry number (e.g., #1, #2, #3) — unique to your account, sequential by time
- The time it was logged
- The logged text — a human-readable description of what was captured
- A numeric value where applicable (calories, amount spent, hours slept, etc.)
- Any tags applied to the entry (clickable to view tag details)
- The category pill (clickable to view category details)
Synapse — Entry Comparison
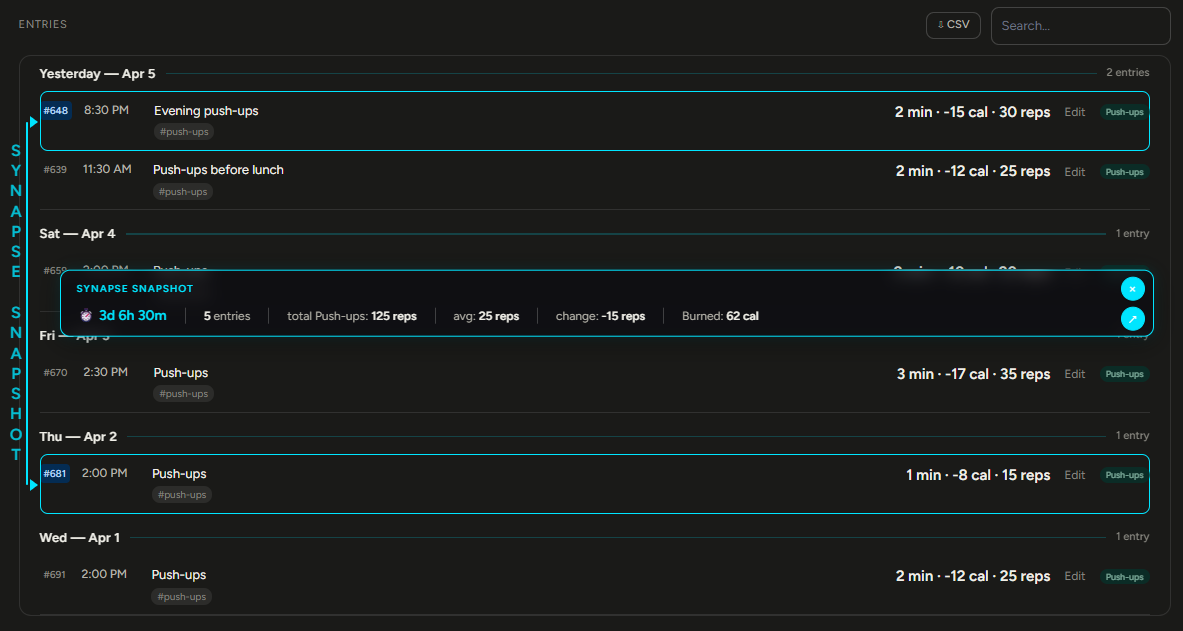
Synapse lets you compare any two entries side by side. Click anywhere on an entry row (except the Edit button, tags, or category pill) to select it. A hint appears: "Synapse: #N selected — click another entry to connect." Click a second entry to see:
- Time elapsed between the two entries
- Entry count — how many entries were logged in between
- Data comparisons — differences in values between the two entries
Both selected entries get a cyan outline with a pulse animation. On desktop, a vertical connector bar links them with labels. On mobile, a compact inline summary appears. Clicking a third entry clears the selection and starts fresh. Synapse is available on Pro and Special tiers.
Filtering and Navigation
Use the date range dropdown to filter entries: Today, Last 7 days, Last 30 days, Last 90 days, or All time. Click any category card to drill into that category, or click a tag pill on any entry to see all entries for that tag. The entry list in every view respects the selected date range.
Charts and Trends
The dashboard includes charts that plot your data over time — helpful for spotting patterns in caloric intake, spending, mood, and more. Charts update automatically as new entries are logged.
Find Trends
Click the Trends button (available on the overview, category detail, and tag detail views) to run an AI-powered trend analysis on whatever you're looking at. NogginLogger gathers your entries for the current view and date range, pre-computes detailed statistics, and sends them to Claude for 3-5 actionable observations about patterns in your data. Results appear in a modal, and you can email them to yourself for reference.
Share Cards
Share your progress on social media with beautiful share cards — dark-themed 1080x1350 PNG images generated right in your browser. The Share button appears on:
- Today's summary — donut chart with stats and custom tracker goals
- Category detail views — metric cards and charts
- Tag detail views — charts with goal progress
- Synapse comparisons — time elapsed and comparison metrics
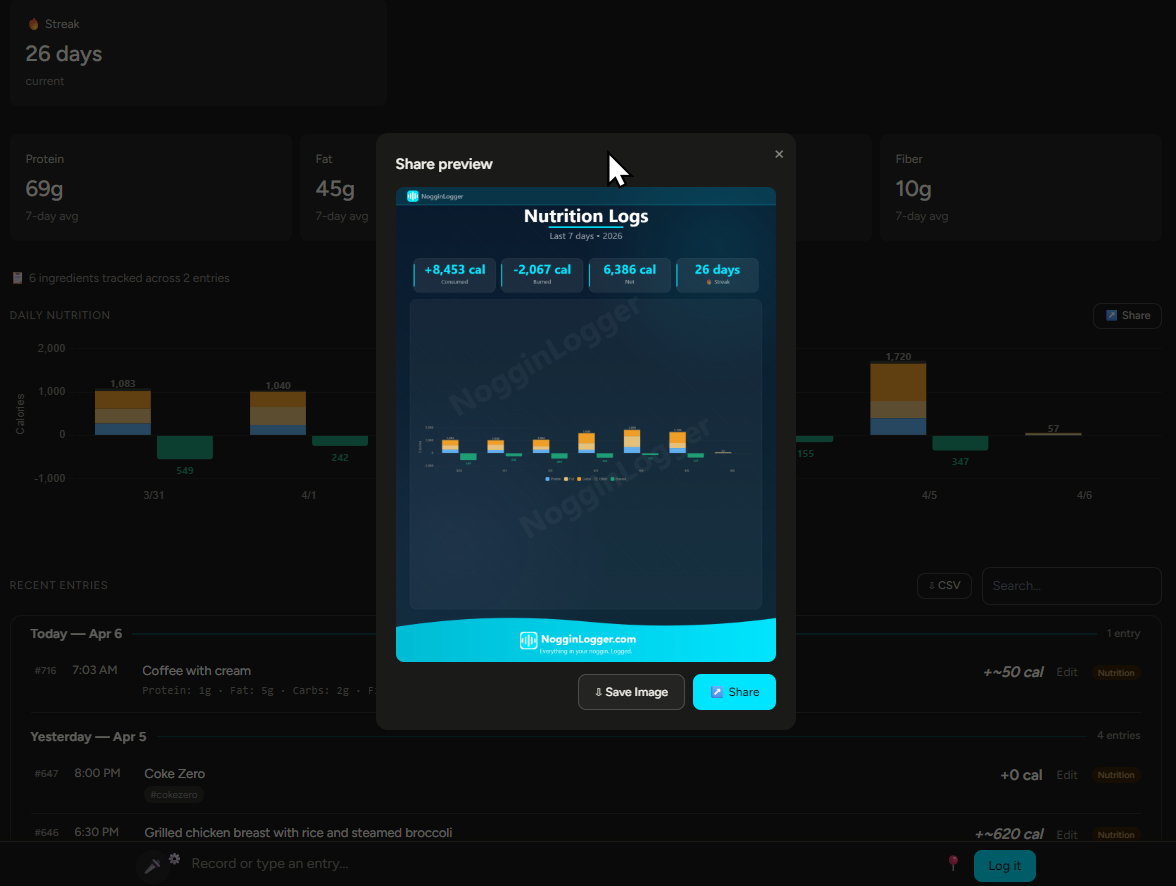
Cards include NogginLogger branding and a motivational quote. If your visible entries include private content, you'll get a warning before sharing. Share cards are available on Pro and Special tiers.
Sharing the card: on a phone, tap Share to open your device's native share sheet — the card image and a link travel together in one tap to any app (Messages, Instagram, WhatsApp, etc.). On desktop you can Save image to download the PNG, Copy link, or jump straight to a platform composer (X, Facebook, Reddit, WhatsApp, Threads, LinkedIn, or email). The link points to nogginlogger.com — your personal card rides along as the attached image, never a public page of your data.
Unread AI Banners
Journal summaries and auto-generated insights from the past 7 days that fall outside your current date range appear as cyan-accented banners at the top of the dashboard. This prevents you from missing a journal entry that was logged late at night when you're viewing "Today" the next morning. Each banner has a View button to jump to the relevant detail view, and you can dismiss them individually.
Streaks
NogginLogger tracks two types of streaks for your tags, categories, and overall logging:
- Logging streaks — consecutive days with at least one entry. Shown as a fire icon with a day count.
- Goal streaks — consecutive days where you met your daily goal. Shown as a target icon. For "stay under" goals, the streak counts days you stayed under the limit.
Streaks appear on custom trackers in the daily snapshot, on tag and category detail views, and are included in share cards.
Location Logging
Click the location pin toggle next to the input bar to enable location tagging on your entries. When enabled, your browser's geolocation coordinates are saved with each entry you create. Entries with a location show a "map" link that opens Google Maps at that spot. The toggle state persists between sessions. Location is entirely opt-in — you can turn it on and off at any time.
Smart Tag Metrics
Tag detail views automatically adapt their metrics and chart style based on how the tag is configured:
- Trending tags (configured with Latest or Average aggregation) show Latest value, Average, Range (min-max), and Change (first to last). Charts display as line charts with an auto-scaled Y-axis.
- Sum tags (configured with Sum aggregation) show Count, Total, and Daily average. Charts display as bar charts with a count overlay.
Charts for trending tags are trimmed to start from the date of the first entry — no empty space on the left when your data doesn't span the full range.
Editing an Entry
Click Edit on any entry to open the edit modal. You can change:
- Transcript — the original text
- Category — reassign via dropdown if the AI miscategorized. Defaults to "General" if unset.
- Values — calories, amounts, exercise minutes, etc. Replace estimates with exact figures
- Tags — add or remove tags
- Reminder — set a reminder to come back to this entry (Pro)
Two save options: Save saves your manual edits directly. Re-evaluate with AI sends the transcript back through Claude for a fresh parse — useful if you've reworded the transcript and want the AI to re-interpret it.
Tip: If the AI categorized something wrong (e.g., tagged a health entry as spending), the fastest fix is to change the category dropdown in the edit modal and hit Save. No need to re-run the AI.
Repeat an Entry
Log something often? Click the ↻ Repeat button on any entry to log it again for today. The edit modal opens pre-filled with everything from that entry — its values, tags, and category — so you can confirm it or tweak a number (like your weight) before saving. It's instant: no re-recording, no waiting on the AI, and you get the exact same values every time. Repeat works on every plan, and each repeated entry counts toward your daily entry limit like any other.
Favorites PRO
For the things you log the most, click the ☆ star on an entry to save it as a Favorite. Your favorites appear as one-tap chips in a tray just above the input bar, so your morning coffee or your usual workout is always a single tap away — it opens the same quick confirm screen as Repeat. A favorite is a saved snapshot: editing or deleting the original entry never changes it, and you can remove a favorite any time with the × on its chip. Save up to 20. Available on Pro and Special tiers.
Tip: Repeat and Favorites reuse the values already stored on the entry, so they never re-run the AI — that means no waiting and no small changes to the numbers each time. Great for staples like a daily supplement, your regular lunch, or a standard gym session.
Daily Journal PRO
NogginLogger can write a daily journal summary — a short AI narrative that reflects on everything you logged that day. When viewing a single day, click the ✎ Summarize button in the snapshot header to generate one on demand. Run it again any time to refresh the summary as you add more entries. Summaries are saved in the Journal section of the dashboard — a nice way to look back on a day at a glance. Available on Pro and Special tiers.
Reminders PRO
Set a reminder on any entry to come back to it later. Open the edit modal and choose from preset times (30 min, 1 hour, 3 hours, tomorrow morning, 2 days, 1 week, 1 month, 1 year) or pick a custom date and time.
When a reminder comes due, a banner appears at the top of the dashboard with the entry text and a Dismiss button, and you'll get a push notification on your phone — with an email as a fallback. Entries with an active reminder show a 🔔 icon with a live countdown (e.g., "🔔 3h 20m", "🔔 due") in the log list.
Recurring Reminders PRO
Reminders can repeat — hourly, daily, weekly, or monthly. Just say it naturally: "remind me every morning to take my vitamins," "every Monday at 9am," or "the 1st of every month." You can also set the cadence manually with the Repeat controls in the edit modal (frequency, time of day, weekday, day-of-month, and an end condition).
A recurring reminder re-arms itself after each time it fires, and its entry pill shows a 🔁 icon with the cadence. Use Stop in the edit modal to end a series (distinct from dismissing a single occurrence). Recurring reminders repeat up to 20 times by default when you don't state an end.
Tip: You can set reminders entirely by voice! Just say "remind me" in your recording — for example, "Had a dentist appointment, remind me in 6 months" — and NogginLogger sets the reminder and tags the entry with #reminder. Add "every…" for a repeating one.
Ask Your Data PRO
You can ask NogginLogger questions about your own data — by voice or typed. Say or type something like "How many days have I met my squats goal?", "What did I spend on coffee last week?", or "What's my average sleep this month?" NogginLogger computes the real figures from your entries and Claude answers in plain language. The answer is saved as an insight entry you can find later. Available on Pro and Special tiers.
Auto Insights PRO
NogginLogger may also occasionally surface a brief AI-generated observation about patterns in your data — for example, noticing that you tend to sleep better on days you exercise. These appear as special entries marked with a ✦ icon. They're never judgmental, never mention goals, and only appear when there's something genuinely interesting to point out (at most once per day). Available on Pro and Special tiers.
Today's Noggin Logs
The top of the dashboard features a visual daily snapshot — a doughnut chart showing calories consumed vs. burned, alongside key stats for the day. You can pin categories and tags to show as mini cards with progress rings. To pin an item:
Click any category card or tag pill on the dashboard.
For tags, this is in the Configure tracking panel. For categories, it's the config bar at the top of the detail view.
Pick Sum (today only), Average, High, Low, or Latest (all-time data). For example, set weight to "Latest" to show your most recent weigh-in, or golf to "Avg" for your average score.
Everything is configured from one place — the tag or category's own detail view. No separate settings modal.
Drilling Into the Data
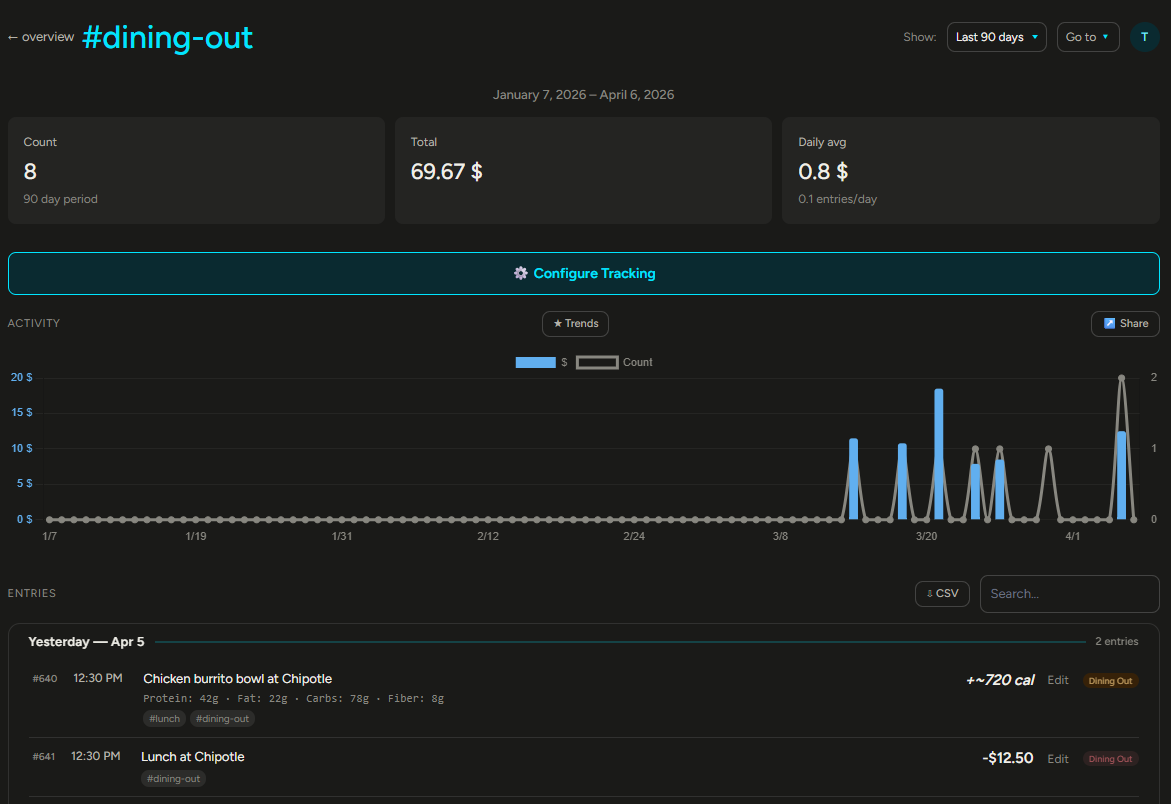
Click any category card on the overview to see a detailed breakdown with charts and entry lists. For spending, the chart bars are clickable — tap a day to see exactly what you spent and on what, with a daily total.
Charts show the date range you've selected (Today, 7, 30, 90 days, or All time), and you can switch ranges at any time using the dropdown in the top right.
Managing Categories and Tags
The Manage page (accessible from the dashboard navigation) lets you add, edit, rename, and delete categories and tags. When renaming or deleting, you choose whether the change applies globally (updating all existing entries) or only to new entries going forward.
Search & Export
Every entry list on the dashboard includes a search box and a CSV export button — on the overview, in category detail views, and in tag detail views.
Searching Entries
Type in the search box to find entries by keyword. Search looks through transcripts, parsed data values, and tags. Results appear instantly (after a brief pause while you type).
You can also search by date. The following formats are supported:
todayoryesterday3/17or03/17(month/day, assumes current year)3/17/2026or03/17/20262026-03-17(ISO format)March 17orMar 17
When searching within a category or tag view, results are automatically scoped — searching in the #cokezero tag view only returns #cokezero entries that match your query.
Exporting to CSV
Click the CSV button next to any search box to download your entries as a CSV file that opens directly in Excel, Google Sheets, or any spreadsheet app. The export:
- Respects your current filters — date range, category, tag, and search query
- Includes entry numbers, dates, times, categories, transcripts, tags, and all data fields as separate columns
- Shows timestamps in your timezone
- Respects privacy settings — private entries are redacted if your toggle is off
Tip: To export everything, select "All time" from the date range dropdown before clicking CSV. To export a specific day, search for the date (e.g., "3/17") and then export.
Track Anything
Tags are the heart of NogginLogger. While categories are assigned automatically by the AI, tags are where you define what matters to you. Track medications, water intake, specific foods, habits, hobbies, golf scores, bird sightings, sales calls — anything you can think of.
How It Works
Every entry can have one or more tags attached. Tags work independently of categories — you don't need to worry about which category an entry is in to use tags. A Coke Zero entry gets the #cokezero tag automatically, and you can track consumption, set goals, and see charts. Click any tag pill on an entry to see its dedicated detail view.
Configurable Metrics
Each tag can be configured to track data in different ways. On the tag detail view, click Configure tracking to set:
| Setting | What it does |
|---|---|
| Display name | A friendly name shown in charts (e.g., "Coke Zero" instead of "#cokezero") |
| Track | Count (how many entries) or Value (sum a numeric amount from each entry) |
| Unit | The label for the tracked metric — cans, oz, mg, litres, cups, doses, miles, whatever fits |
| Keywords | Words that auto-apply this tag when detected in a voice note (e.g., "coke zero", "diet coke") |
| Daily goal | An optional target shown on the tag detail view |
Dual View — Count + Value
When a tag has a unit configured, the detail view shows both metrics simultaneously: a bar chart for the measured value (e.g., ounces) and a line overlay for the count (e.g., number of servings). The metrics cards show total, daily average, and entry count side by side.
Real-World Examples
Here are some ideas for what you can track with tags:
The power is in the keywords. Once you set up keywords for a tag, you never have to think about it again — just speak naturally and the tag applies automatically. Say "grabbed a coffee on the way to work" and the #coffee tag is applied without you saying the hashtag.
Custom Fields (Pro)
Pro users can define custom fields on any tag to track arbitrary data beyond the built-in count and value. Each field has:
- Key — an internal identifier (letters, numbers, underscores)
- Label — the friendly name shown in the UI (e.g., "Handicap")
- Type — number or text
- Unit — optional label for the value (e.g., "strokes", "pages")
- Chart mode — how the field is charted: Sum, Average, Latest, or None
You can add up to 10 custom fields per tag. Custom number fields automatically appear in the Track dropdown so you can chart them. The field schemas are passed to the AI parser, so Claude knows to extract the right data from your voice notes.
Example: Create a #golf tag with custom fields for "score" (number, strokes, avg) and "course" (text). Say "Played 18 holes at Pebble Beach, shot an 82" and the AI extracts both fields automatically.
Tag Config Preview
The Configure tracking panel includes a live preview that updates as you change settings. It shows sample metric cards, a goal progress bar, and a fully labeled chart (axis labels, data point labels, goal line in legend) so you can visualize exactly how your choices will look before saving.
Editing Values
Click Edit on any entry to see and modify its tracked values directly — calories, amounts, exercise minutes, or the generic value field used for tag tracking. Estimated values (marked with ~) can be replaced with exact figures. The edit modal shows fields tailored to the entry's category:
- Nutrition: Calories, meal description
- Exercise: Calories burned, duration, activity type
- Spending: Dollar amount
- Any tag: The value field (oz, cans, doses, etc.)
You can also change the category, manage tags, and save without re-running the AI parser. Or click Re-evaluate with AI to have Claude re-parse the transcript from scratch.
Automatic Calorie Estimation
For exercise entries, NogginLogger always estimates calories burned based on the activity type and duration using standard MET values (Metabolic Equivalent of Task). For example, tennis is ~8 MET, running ~10 MET, walking ~3.5 MET. These estimates appear with a ~ prefix and can be replaced with actual figures if you have a heart rate monitor or fitness tracker.
For food entries, common items get calorie estimates when you don't state a specific number. Again, marked with ~ so you always know what's real vs. estimated.
Tags & Privacy
Tags can also be applied manually — say #private or #cheat-day in your voice note and the AI will pick it up. Or add tags after the fact from the Edit modal on the dashboard.
Auto-Tag Keywords
Tag rules can have keywords that automatically apply the tag when detected in a voice note or typed entry — no need to say the hashtag. For example, set the keywords "coke zero" and "diet coke" on the #cokezero tag, and any time you mention those phrases the tag is applied and the quantity is extracted into the tag's value field.
Keywords are configured in the Configure tracking panel on any tag's detail view. The AI parser is aware of all your keyword rules, so it knows to look for them and extract the right data. Auto-tag keywords are available on Basic, Pro, and Special tiers.
The #private Tag
Any entry tagged #private is hidden on the dashboard when the privacy toggle is off. The entry still exists, and its numeric values still count toward your totals — only the display text is redacted, showing "Private entry" instead.
Toggle Show private content on your Profile page to reveal or hide private entries. This is useful when you're sharing your screen or when someone else might glance at your dashboard.
Private entries are hidden visually, not encrypted. Anyone with access to your account can reveal them by toggling the setting. Don't use #private as a security measure for highly sensitive information.
Membership Plans
NogginLogger offers three membership tiers. Everyone starts on the Free plan — upgrade when you're ready for more.
| Feature | Free | Basic · $5/mo | Pro · $12/mo |
|---|---|---|---|
| Entries per day | 7 | Unlimited | Unlimited |
| Max recording length | 15 sec | 30 sec | 60 sec |
| History | 7 days | 90 days | All time |
| Tags | 3 | 10 | Unlimited |
| Today's Noggin Logs custom trackers | 0 | 2 | 4 |
| Text search | Yes | Yes | Yes |
| Date search | — | Yes | Yes |
| CSV export | — | Yes | Yes |
| Auto-tag keywords | — | Yes | Yes |
| Custom fields on tags | — | — | Yes |
| Daily journal summaries | — | — | Yes |
| Synapse (entry comparison) | — | — | Yes |
| Share cards | — | — | Yes |
| Entry reminders | — | — | Yes |
| AI insights (ask your data) | — | — | Yes |
| Auto insights | — | — | Yes |
| Find Trends (AI analysis) | — | — | Yes |
| Recurring reminders | — | — | Yes |
| Macro tracking (P/F/C) | Yes | Yes | Yes |
| Desktop mic + typed entries | Yes | Yes | Yes |
| User bio for better estimates | Yes | Yes | Yes |
Annual Billing
Save 20% by switching to annual billing. Toggle between Monthly and Annual on the Membership page to see the discounted prices:
- Basic: $48/year ($4/month, saves $12/year)
- Pro: $115/year ($9.58/month, saves $29/year)
How to Upgrade
Visit the Membership page from the navigation bar. Choose your plan and billing period, then complete checkout securely through Stripe. Promo codes are supported at checkout — if you have one, enter it on the Stripe payment page for a discount.
Manage Your Subscription
Already subscribed? Click the Manage Subscription button on the Membership page to open the Stripe Customer Portal, where you can:
- Update your payment method
- Switch between plans (Basic/Pro, Monthly/Annual)
- Cancel your subscription
- View your billing history and invoices
What Happens If I Downgrade?
Your data is never removed or hidden when you change plans. All your existing entries, tags, custom fields, and configurations stay intact. Only future actions are limited — for example, you won't be able to create new tags beyond your plan's limit, but existing tags continue to work.
Tip: The Free plan is fully functional for basic logging. If you find yourself wanting keyword auto-tagging, longer recordings, or CSV exports, that's a good sign it's time for Basic. Pro is for power users who want custom fields, journal summaries, and unlimited everything.
Negative Goals
All plans support both "reach" and "stay under" goals. For example, set a nutrition goal to stay under 2,000 calories per day — the progress ring will show how much room you have left, turning orange as you approach and red if you go over.
Example Voice Notes
Here are some examples of voice notes and how NogginLogger interprets them.
You can combine as many categories as you like in a single note. NogginLogger will split them into separate entries automatically. More ideas here →
Support & Your Profile
Onboarding Wizard
New users see a 5-step onboarding wizard on their first visit to the dashboard (after accepting the terms of service). It helps you get set up quickly:
A quick introduction to NogginLogger and what to expect.
Fill in optional profile fields (height, weight, age, etc.) so the AI can make better estimates. Only shows fields you haven't already filled in — skipped entirely if your bio is complete.
Toggle on category presets (Calories, Exercise, Weight, Mood, Sleep, Spending), tag presets (Water, Coffee, Steps), or type in custom tags. These are auto-configured with sensible defaults and pinned to your daily snapshot.
A quick tour of what NogginLogger can do — Auto Insights, Streaks & Goals, Custom Fields, Quick Share, Synapse, Reminders, Ask Your Data, and Auto-Tagging — so you know what's available as you go.
Review your choices. Everything is saved — tag rules, category rules, and glance items are all created automatically.
The wizard is skippable at any step. You can always configure everything manually later from the tag and category detail views on the dashboard.
Getting Help
If you run into a problem or have a suggestion, visit the Support page (available from the dropdown menu under your name). You can:
- Submit a ticket — choose a type (bug report, feature request, question, or other), describe the issue, and submit
- Track your tickets — see all your past tickets with their current status (open, read, resolved)
- Reply to conversations — click any ticket to see the full thread and add replies. Our team will respond via the same thread and email
You'll receive a confirmation email with your ticket number (e.g., NL-00001) when you submit, and email notifications when we reply.
Your Bio
Visit your Profile page to fill in optional bio information — height, weight, age, sex, activity level, dietary preferences, and health notes. This data helps the AI make more accurate estimates:
- Calorie burn estimates use your actual body weight instead of a generic default
- Food estimates are adjusted based on your dietary preferences
- Journal summaries have more personal context
All fields are optional. Share as much or as little as you like — any information helps improve accuracy.
Mobile App Connection
Your Profile page also shows your API key — this is what connects the mobile app to your account. If you need to set up the app on a new device, copy the key from your profile and enter it in the app.
Deleting Your Account
If you'd like to permanently delete your NogginLogger account, you can do so from either the web or the mobile app:
- Web: Go to your Profile page and scroll to the red "Delete Account" section at the bottom. Click the button, confirm, then type your email to finalize.
- Mobile: On the main screen, tap Delete Account below Sign Out. You'll see two confirmation prompts before anything is deleted.
Deleting your account is permanent and immediate. All of your entries, recordings, tags, custom trackers, support tickets, and profile data are removed from our servers. If you have an active paid subscription, it will be cancelled at the end of the current billing period so you aren't charged again.
Data & Privacy
NogginLogger is a personal tool — your data is your own. Because your notes are processed by third-party AI, you're asked to agree to a one-time AI consent notice — naming OpenAI (Whisper) and Anthropic (Claude) — when you first start using the app or dashboard. Here's what happens to your voice notes:
Your audio file is sent securely to the NogginLogger server over HTTPS.
Your audio is sent to OpenAI's Whisper API to be converted to text. OpenAI's standard data policies apply to this step.
The transcript is sent to Anthropic's Claude API to extract structured data. Anthropic's standard data policies apply here.
The resulting structured entry is saved to your account database. Only you can see your data when logged in.
Avoid including highly sensitive personal information (passwords, financial account numbers, etc.) in your voice notes. Treat NogginLogger like a personal diary that uses cloud AI services.